Client-Side_Charting_GoogleCharts
Description
Demonstrates a variety of charts created using Google Charts.
Discussion
The Client-Side_Charting_GoogleCharts UX template includes examples for several charts created using Google Charts.
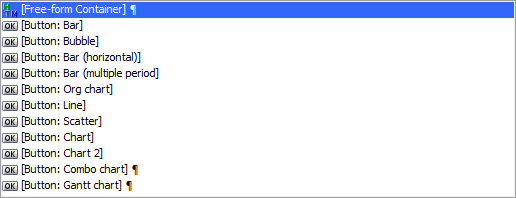
Template Tree
The template contains a static text control with a DIV and a row of buttons below. Clicking a button will call a JavaScript function to render an example chart for the chart type described by the button's text.
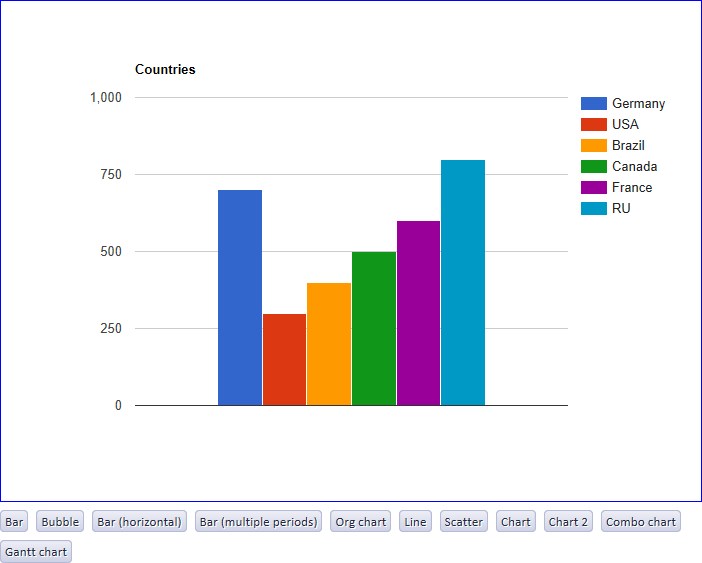
In Live Preview
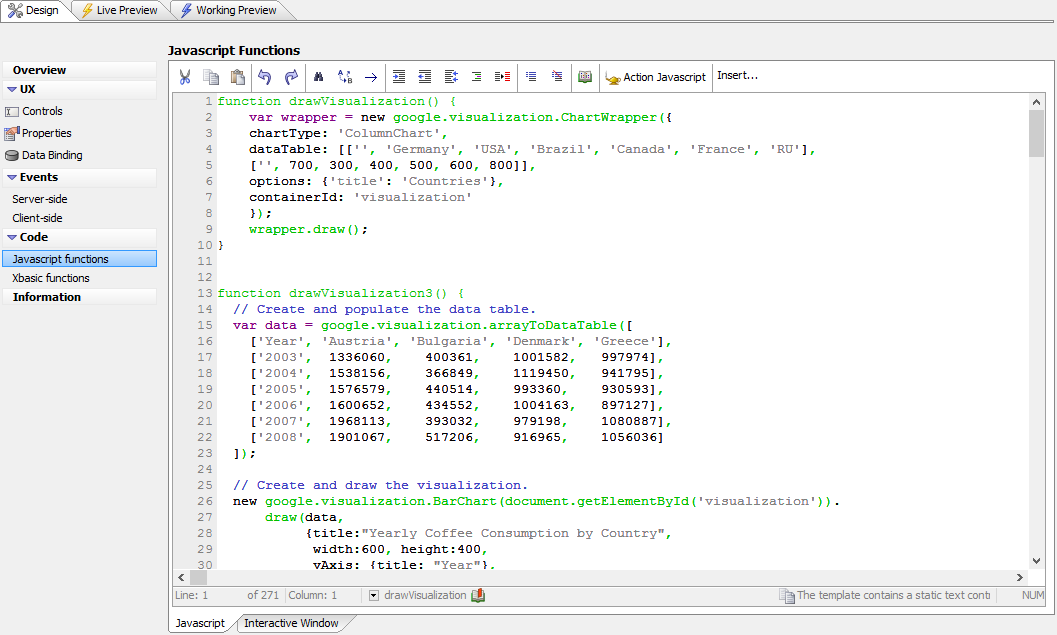
The code that creates the charts is defined in the Javascript Code section of the UX Builder. Here, you will find JavaScript demonstrating how each chart is created, including how chart data is structured, any options that were added, and how to call into the Google Charts API to generate the charts.
See Also